
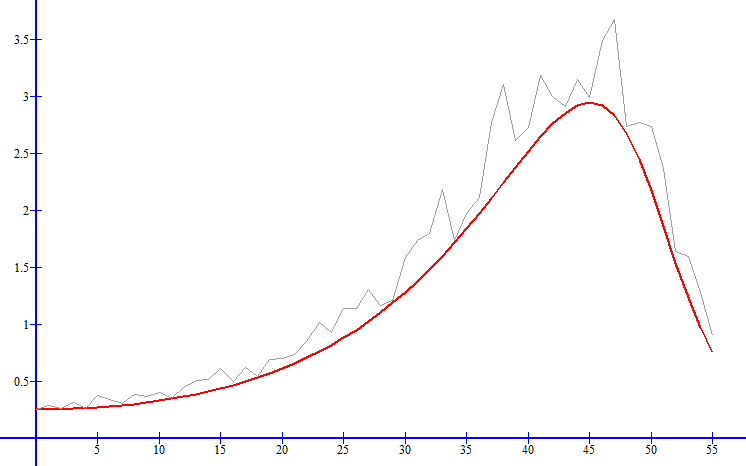
Votlaerra-Lotka or prey-predator equations resemble stock market graphics. An increase in volume is offset by an increase in price, which brings down the volume of trades. We have,
x’ = x – xy
y’ = -y + xy
If x is the prey, the interaction with the predator is negative. The opposite is true for the predator. Negative y indicates the predator would die out with no prey.
There is no time variable aside from x’ = dx/dt. Euler’s method is used to plot the trajectory.
Sub vl_euler()
‘ dx/dt = x(1-y)
‘ dy/dt = y(-1 +x)
n = 55
Dim x(0 To 55) As Double
Dim y(0 To 55) As Double
Dim xr As Single
x(0) = 0.25
y(0) = 1
h = 0.1
Cells(1, 1) = 0
Cells(1, 2) = x(0)
For i = 1 To n
Randomize
xr = Rnd
x(i) = x(i – 1) + h * (x(i – 1) * (1 – y(i – 1)))
Cells(1 + i, 2) = x(i) * (1 + xr * 0.4)
y(i) = y(i – 1) + h * (y(i – 1) * (-1 + x(i – 1)))
Cells(1 + i, 1) = i
Cells(1 + i, 5) = xr
Next i
End Sub
