
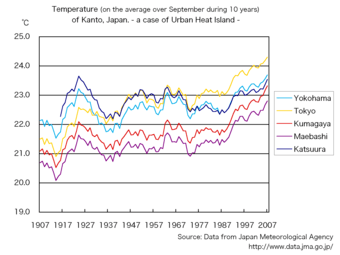
Urban heat Island Effect
The use of air conditioners took off in the big cities starting in the 1970’s. If a million people use a 1 kilowatt unit, then the power company has to supply an extra gigawatt of electricity. The heating effect for Tokyo is about 2 degrees C. over a period of 40 years. Data from the tail end of “Japan Meteorological Society” looks very similar to a climate emergency graph.
Thermal Pollution
Heat engines must obey the laws of the Universe. For example, the CANDU nuclear reactor generates 1744 megawatts of thermal energy for every 508 megawatts of electrical energy. Power plants are typically near a river where water is taken upstream and discharged at a warmer temperature downstream. In other words, 2/3 of the energy goes into the river.
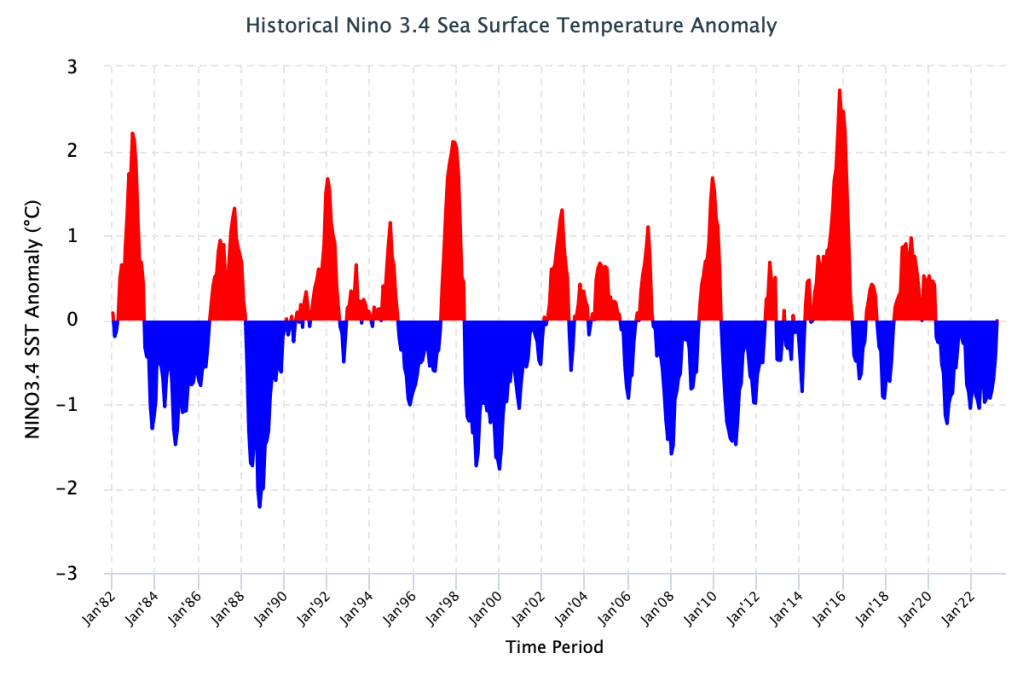
The most dramatic warm water event is El Niño. When this occurs, it is often most intense at Christmas. This is why the graph aligns each year with January. Sometimes these weird things are explained by Fourier analysis; for example, 3 sine waves look like a triangle wave. See also how the moon may influence Pacific oscillations.

climatehoax.ca@gmail.com
